1. Introduction
§1 Over the last three decades, scholars of medieval cartography have sought to reclaim the reputation of medieval mapmakers. The maps and their makers have, at times, been overlooked, due in part to nineteenth- and twentieth-century perceptions of the lack of geographical knowledge reflected in the perceived “inaccuracy” of medieval maps. More recently, however, scholarly attention has shifted away from lacunae, and towards the recognition and appreciation of calculated rationales and purposeful intentions that guided medieval mapmaker’s cartographic representations (Kupfer 2016; Talbert and Unger 2008; Edson 1997; Woodward 1987).
§2 Since individual medieval cartographers have left little discursive evidence to explain the design and content of their maps, scholars turn to the implicit evidence contained within the maps themselves, as well as contemporary contextual evidence, in order to better understand medieval conceptions of space, place, and time. Most world maps dating c. 1000–1400 fall into four typological categories: Tripartite (also known as T-O maps), Zonal, Transitional, and Quadripartite maps (Woodward 1987, 294–299). T-O maps depict the world with an orientation rotated 90 degrees to the left; the cardinal direction of East is located at the top of the map. A “T” situated inside an “O,” divides the world into three known continents, with Asia occupying the upper half, and Europe and Africa the bottom left and right quadrants respectively (Figure 1a and b). Of the ten maps that comprise the dataset for this study, eight figures are traditional T-O maps, with seven of these in pictorial format and one in list format (For a complete list of the 10 maps, see Works Cited, Primary Sources). The remaining two maps in the dataset draw their toponyms from medieval narrative descriptions of the world’s geographical content, namely Hugh of Saint-Victor’s Descriptio mappe mundi and his Chronicon (Gautier Dalché 1988, and Baron 1956).
a and b BL, Add. MS 28681, fol. 9r (on the left) and 9v (on the right). With permission from the British Library, © British Library Board.
§3 The study of medieval mappaemundi intersects with several academic disciplines, due to the maps’ rich and varied representations. In order to wholly appreciate the spatial sensibilities of medieval people and their approach to map construction, the field of medieval cartography attracts intellectual and cultural historians, art historians, geographers, cartographers, paleographers, and book historians, to name but a few. Moreover, medieval map study proffers multiple approaches, from digging deeply into a single map and bringing a broad range of scholarly expertise to bear upon its study, as in P. D. A. Harvey’s (2006) The Hereford World Map: Medieval World Maps and Their Context, to peering at multiple maps through a granular lens, such as Martin Foys’s (2006) examination of three early Anglo-Saxon maps.
§4 The study of mappaemundi also relies heavily on the use of comparative analysis, examining map characteristics, such as artistic expression, geolocational design and toponym content, in order to explore ideological and institutional connections between maps, as well as their connections to ancient cartographical traditions from which medieval mapmakers drew inspiration. By comparing the design and content of two Holy Land maps that appear back to back on the same folio in British Library, Add. MS 10049, f. 64r and f. 64v, P. D. A. Harvey has posited an explanation for the drawing, erasing, redrawing, and reconfiguring, first, of a map of Palestine, and then, a map of Asia (Harvey 2012, 31–40). Dan Terkla, professor of English at Illinois Wesleyan University, has argued for a strong relationship between the Durham/Sawley Map (c. 1188), the Psalter Pictorial Map (c. 1265), the Duchy of Cornwall fragment (c. 1283), and the Hereford map (c. 1300), basing his conclusions on similarities between the maps and Hugh of Saint-Victor’s theography, which may have been spread in England through the influence and travels of Lawrence of Westminster, one of Hugh’s students (Terkla 2013). The parsing of mappaemundi into map families, however, remains a challenge, due in part to the complex nature of reading and comparing medieval toponyms.
§5 Medieval mapmakers often populated their maps with the combined geographical knowledge of classical authors, such as Pliny (Rackham, Jones and Eichholz 2014), Solinus (Werner 1969), Orosius (Fear 2010), and Isidore of Seville (Barney et al. 2006), direct experiential knowledge, and indirect knowledge that came by way of medieval travellers and their writings. The widespread infusion of these toponyms drawn from classical sources, obscures the uniquely medieval interventions that often hint at institutional or personal agendas behind the construction of a given map. While the combination of classical and medieval knowledge creates an individual map signature; the sheer number of toponyms contained in over 900 surviving medieval maps make the detailed work of transcribing and comparing composite lists of toponyms across multiple maps a near impossible task, if done by hand. Consequently, the comparison of place names for medievalists has, until now, been conducted by hand, usually on a case by case study.
§6 The possibility of designing a tool that automates toponym comparison originated from conversations between a data scientist and a medieval historian, and from the desire to facilitate the study of the complex relationships between mappaemundi vis à vis their textual content. Medieval cartographical scholarship has already benefited from advancements in digital technologies with projects, such as Fordham University’s interactive Oxford Outremer and Independant Crusaders map projects, as well as Rochester University’s use of multispectral imaging with the Vercelli map (Fordham University 2019; Van Duzer 2019; Rochester University 2019). Geographic Information Systems in particular have enabled scholars to create visual representations of medieval topographies and layer them over modern ones (Swansea University et al. 2019; Bussell and McNamara 2013).
§7 This paper introduces a new digital tool for map study, called veccompare (Vector Compare). Veccompare is an open-source package for the scripting language R that automates and expedites making comparisons within a current dataset of 1837 normalized medieval cartographic place names. By providing new information about areas of toponym overlap and uniqueness, veccompare is suited to address large-scale research questions across multiple maps, such as trying to identify a set of common toponyms drawn from a particular ancient source, as well as smaller-scale questions that may seek to parse the degree of toponymic relationship between two maps only. The veccompare dataset comprises ten medieval maps (and counting), but these ten maps set a model for future additions—and the dataset and code are available for use in current and future medieval cartographical scholarship (https://zenodo.org/record/1453557).
§8 The intent and implementation of this project stemmed from the desire to incorporate available digital technologies into traditional humanist methodologies, and in doing so, as with most digital humanities projects, it has also uncovered new questions and new directions for future study. As a case study, the authors have used the veccompare tool to shed light onto a puzzling question concerning the relationship of two mappaemundi held in a thirteenth-century psalter (Figure 1a and b). The two maps appear on the recto and verso of the same folio, but scholars have noted that they do not seem to be linked directly through toponym content. Veccompare has allowed for the visualization of data from a different perspective that suggests that the Psalter maps’ close physical proximity, i.e. on the same folio in the same manuscript, is perhaps pursuant not to a direct, one-to-one, model-derivative type of toponymic relationship, but instead to an indirect relationship stemming from a common textual source used by both mapmakers.
2. Description of veccompare
2.1. The dataset
§9 Medieval data is “fuzzy”. Part of making it operable for, and accessible to computers necessitates an intermediary step, namely turning it into twenty-first-century-ready data, a back and forth process that takes place between a scholar with domain expertise and a scholar who has expertise of the system within which that data has to fit. In order to create a twenty-first century dataset of relevant medieval toponyms, the authors worked with original sources and followed the traditional practice of creating two categories for each place name, a diplomatic transcription, which reflects the spelling of the toponym, as it appears on the map or in the narrative source, and a normalized transcription, a version of the place name that can be compared across multiple maps. Because the place names have been drawn from pictorial maps, list maps, and narrative map sources, the textual toponym serves as the common denominator for both diplomatic and normalized transcriptions. (The full dataset appears at the beginning of the appendix.)
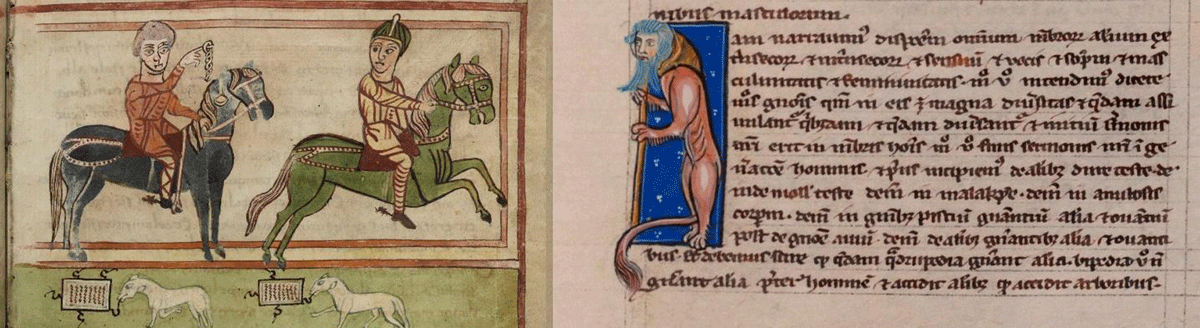
§10 One of the benefits and responsibilities of working with digital humanities projects is the opportunity to articulate editorial decisions, making them explicit and transparent. To this end, the normalization decisions made for the medieval place name dataset required careful thought and clear reasoning. To begin, the authors addressed issues regarding the selection of place names to include in the dataset, as well as those to omit. For example, not all the text on the ten mappaemundi in the dataset denoted what one might consider to be a traditional place name or geographical feature. For this dataset, a “place name” is defined as the textual label of a specific geographical feature on the map, and to include such features as cities, provinces, monuments, oceans, mountains, and winds—but not cardinal directions, even if they were labelled on the map. Because medieval cartographers used the names of animals and mythic creatures to depict the geographical areas, in which they lived, these too were included in the dataset. For example, the Psalter Pictorial map, the Hereford Map, and Hugh of Saint-Victor’s Descriptio mappe mundi all illustrate or mention the blemmyae, creatures who had no head, but had eyes in their chests, and lived in the southern regions of Africa; the phoenix, a mythical bird, appears only in the Hereford Map and Lambert de Saint-Omer’s world map in the Liber Floridus, both in Africa, but in different parts of the continent. Moreover, if the place names for three geographical features—the Red Sea, the Persian Gulf, and the Mosaic Crossing—were unlabelled, but clearly-depicted and unambiguous, the authors inserted these names into the dataset since their easily-recognizable nature and universality can be taken as a label unto itself. The diplomatic place names from the sample of ten medieval mappaemundi were then transcribed into an excel spreadsheet.
§11 The process of transforming the diplomatic place names into normalized ones involved a number of unexpected decisions. When normalizing medieval place names, expertise is needed in order to know whether two seemingly-related place names categorically refer to the same place and to be able to label them as such, or whether two similar place names refer to the city, river, or region of the same name. Moreover, when confronted with multiple spellings, decisions had to be made as to which one should be used as the standard normalized spelling. For this project, the foundational normalizing principle was to use the most common spelling across the dataset of maps. For example, the dataset contained several variants of “Scythia”—scithia, scythia, sitia, scithie and scitia; and the variants of Scithia were consolidated into the most common spelling, namely Scythia. But to complicate the matter, it was also the case that Scythia often had a qualifier, such as lower or upper Scythia. In this example and others like it, the authors decided to keep Scythia as a standalone place name, adding Scythia Inferior and Scythia Superior as separate toponyms. Noting that two maps share Scythia and that two others share Scythia Inferior was more interesting, we reasoned, than noting that more than four maps share Scythia.
§12 The authors were also confronted with decisions regarding the extent to which qualifiers associated with place names should be included in the normalized versions. While one mapmaker might have labeled the city of Alexandria as Alexandria c., indicating that this toponym is the civitas, or city of Alexandria, another mapmaker might have only written Alexandria as the label, leaving it up to the reader to decipher its status as a city or region. It became clear that certain qualifiers had to be included in the normalized version of certain place names, even if they were absent from the diplomatic reading, since some toponyms used could refer to a city, a river, a region, and/or a people. The label of Babilonia, for example, sometimes referred to the city and sometimes to the region. Thus, even if the diplomatic transcription did not include a qualifier, the normalized version of the place name acquired a qualifier to distinguish it from others with the same name. This decision meant that the city of Babilonia (Bablionia c.) could be compared with other cities of Babilonia across all maps, separate and distinct from the maps that contained the region of Babilonia (Babilonia r.). In cases where it was difficult to determine if a toponym referred to the city or region, both c. (civitas) and r. (regio) were included in the normalized transcription.
§13 Certain normalized names took on even more precise qualifiers in order to distinguish them from each other. For example, Hugh of Saint-Victor’s Chronicon (Baron 1956, 144) lists no less than twelve different cities named Alexandria. Most medieval maps only include the most well-known iteration of Alexandria, i.e. the city in Egypt. But since the dataset includes all of Chronicon’s place names, Alexandria in Egypt became Alexandria in Egypto c. in its normalized version across all maps, so that it would be not be confused with Alexandria iuxta Tigris (next to the Tigris River) or the other ten Alexandrias listed in the Chronicon. At times, executive decisions were made, such as the case of Hellespontus (the Hellespont) normalized into one word, while Euxinus Pontus (Black Sea) remained as two words. In instances where the place name was unambiguous, like Roma, and there was only one concept and location for Roma, no qualifier was necessary.
§14 Finally, issues arose in instances where two place names were included in the one diplomatic transcription, such as the label Are Liberi et Columne Erculis [Altars of the Free and Pillars of Hercules] that appears on the Psalter Pictorial map. In these cases, the dataset contains two identical diplomatic transcriptions of Are Liberi et Columne Erculis. For each identical diplomatic transcription, the normalized transcription is broken up into its separate parts, i.e. one that denotes Are Liberi only; and one that denotes Columne Erculis only. In this way, one can compare how many maps include the Pillars of Hercules, how many include the Altars of the Free and how many include both.
§15 Overall, the authors took a conservative stance regarding normalization, using the diplomatic transcriptions and domain expertise, as the basis for adding qualifiers to certain toponyms only when necessary. If, in the rare instance that a diplomatic transcription was ambiguous, a question mark was used at the end of the place name to indicate possibility and/or doubt. While it may have been tempting to add other qualifiers, like the name of the continent in which the place name was located, the authors considered this to be an excessive intervention, since some of the maps do not delineate these boundaries with explicit labels or markers.
§16 The normalization of place names emerged from an on-going and iterative process. As more maps were added to datasets, new toponyms were added to the list of unique toponyms. This afforded an opportunity to revisit and refine the existing list of unique toponyms, rethinking and/or qualifying the normalized transcriptions, as well as adding new normalized place names. Throughout the process, constructing a dataset of normalized medieval place name transcriptions was a dynamic and collaborative process, and it is our hope that this activity will continue. While the dataset has been designed for broad comparisons of toponyms, researchers are welcome to tailor the current set of toponyms with alternative normalization approaches, such as adding qualifiers to answer research questions specific to their own work or commenting on the existing one.
2.2. The code
§17 With a normalized dataset in place, a computer code using R software veccompare was created to facilitate data analysis, automatically computing overlap and non-overlap between toponyms across the maps held in the dataset (see Team R Core 2017). Veccompare is a “package” developed in R, similar to an “add-on” or “extension” in a web browser, such as Mozilla Firefox or Google Chrome. R is freely available, can be installed by a user. This software adds and/or makes it easier for new functionality of the base program. The veccompare package is comprised of coding commands called “set operations,” and is built around one primary command, compare.vectors, which takes a named list of elements (in this case the list of normalized place names) from the maps held in the dataset, each of which comprises a collection, or vector, of place names, and computes all possible comparisons between them.
§18 For each comparison, veccompare performs three “set operations.” It finds 1) the total set of elements across maps—the “union,” 2) the total percent overlap across all of the maps involved in a comparison—the “intersection,” and 3) the elements that are unique to each of the maps—the “relative complement” or “difference.” This section of the paper addresses the structure of the code, exactly how it is applicable to the maps in the dataset, the streamlined approach that a tool like this enables, and its potential for use with other datasets that would benefit from the same analysis. To be clear, researchers do not need to know much R to use veccompare. They can apply it knowing just a few syntax rules for specific commands. The Appendix provides step-by-step instructions and a more detailed explanation of RStudio.
2.2.1. The union function
§19 The union function allows veccompare, and thus researchers, to create a list of the total set of elements across as many maps as desired. For example, when wanting to compare toponyms between the Cotton Map and the Psalter Pictorial map, the union function is applied to the two-way comparison and produces an output with two types of information. The output displays a small amount of metadata about the two maps, and only these maps; and it provides the number and names of toponyms of the deduplicated, combined list of all places across both of the maps.
§20 In Figure 2, veccompare has extracted the union, which specifies that an overall comparison of the Cotton and the Psalter Pictorial maps produces 285 unique elements from both maps (Figure 2). This is the sum total all of the different parts of the results together, i.e. the 134 elements unique to the Cotton Map, the 33 elements that overlap on both maps, and the 118 elements unique to the Psalter Pictorial map (134 + 33 + 118 = 285). The union function is also what veccompare uses to create a complete list of toponyms across all maps (currently 1837 unique toponyms) by calculating the union of all ten maps and then alphabetizing the list of normalized place names for easier access.
Venn diagram showing toponym overlap between the Psalter Pictorial (BL, Add MS 28681, f. 9r) and Cotton (BL, Cotton Tiberius MS B.v, f. 56v) maps.
2.2.2. The overlap function
§21 Veccompare’s overlap function produces the set of toponyms that overlap between the maps in the dataset, as many maps as desired, resulting in both a numerical value of overlapping toponyms, as well as a list of the place names themselves. This function is crucial for comparing the toponym content of medieval maps. When comparing the Cotton Map and the Psalter Pictorial map, for example, the result in Figure 2 shows that there are only 33 overlapping toponyms between these two particular maps. This is not surprising, given that the Cotton Map dates to around 1000 CE, and the Psalter Pictorial Map dates to the latter quarter of the thirteenth century, approximately 200 years later. Moreover, the context of the maps within their respective manuscripts suggests that the maps held different functions. The Cotton Map is found within a composite Old English and Latin miscellany that includes various astronomical, cosmographical and computistical texts, in particular a copy of Priscian’s Cosmographia, a fifth-century translation of Dionysius Periegetes. Although the Cotton Map and Priscian’s geographic description of the world share little in common, the intention is “once again an association between the scholarly world and cartography” (Gautier Dalché 2008, 46), suggesting that the map was likely used as a didactic tool. The Psalter Pictorial map, as its name suggests, is part of a larger devotional manuscript, and certain scholars have proposed that the map functioned as a means to facilitate an allegorical or spiritual pilgrimage (Reudenbach 1998), or as a means to internalize simultaneously and dynamically the Psalms text and the visual representations of the places and events to which it refers (Brott 2018). Whatever the psalter’s function, it is certain that the mansucript and its maps were in the hands of a laywoman, Mary Wyndham, by at least the early 16th century (BL Add MS 28681, f. 18r).
§22 Given the substantial differences between the Cotton and Psalter Pictorial maps, the thirty-three toponyms that appear on both maps (a 22% overlap for the Cotton Map and a 20% overlap for the Psalter Pictorial map) merit further examination. Since veccompare has listed the specific toponyms that overlap on both maps, further research confirms that all thirty-three overlapping toponyms appear in either Orosius’s (born c. 375, died after 418 CE) Seven Books of History Against the Pagans (Fear 2010) or Isidore of Seville’s (c. 560–636 CE) Etymologies (Barney et al. 2006), suggesting that the Cotton and Psalter Pictorial mapmakers may have drawn their common place names from classical sources, or sources that referenced the two authoritative authors noted above. (The 33 place names are as follow: Nineveh, Macedonia, Bethlehem, Antiochia, Armenia, Dalmatia, Persia, Constantinopolis, Siria, Mauritania, Jerusalem, Roma, Britannia, Jericho, Scythia, Troia, Cinocephales, Alexandria in Egyptus c., Hibernia, Phison, Cartago in Africa, Getulia, Asia minor, Danubius fl., Nilus, Atlas m., Riphei m., Meroe i., Zeugis r., Arca Noe, Sicilia, Columpne Herculis, and Transitus Hebreorum.)
§23 The comparison of the overlap function between the Hereford and Sawley maps provides a nice counterpart to the Cotton-Psalter Pictorial comparison. Despite the fundamental difference in their size—the Hereford map measures 5 feet by 4 feet while the Sawley map measures only 12 inches by 8 inches—Peter Barber (2006, 10), former Director of Maps at the British Library, notes that “the Sawley map more closely resembles the Hereford map in structure and content than any other surviving early map”. In particular, Barber highlights similarities in illustration, the depiction of river systems, the outlines of certain islands, and toponymic content (see Figure 3). Thus, one would expect veccompare to find a relatively high percentage of toponym overlap – and indeed it does in Figure 3. Veccompare shows that 68% of the Sawley toponyms also appear in the Hereford map.
Venn diagram from veccompare showing toponym overlap between the Hereford (Hereford Cathedral) and Sawley (CCCC 66, Parker Library, p. 2) maps.
§24 The overlap function is not limited, however, to comparing only two maps at a time. When veccompare calculates overlap for all ten maps, three common normalized toponyms emerge: Hibernia, Sicilia, and Roma. On the one hand, this small number of shared toponyms is rather surprising given that almost all the ten maps in the dataset are of English origin, but this may be, in part, due to the normalization process. As noted above, a given map may have replaced Scythia with the more specific Scythia inferior and Scythia superior. In this case, the computer recognizes these as different entities and does not count Scythia inferior and superior simply as Scythia. Therefore, no overlap is counted. On the other hand, however, Hibernia, Scicilia, and Roma are place names that have remained consistent, with little or no spelling variations over several centuries. Moreover, given the predominantly insular origin of the dataset, it is also interesting to note that Britannia is not present on all the maps. The replacement of Britannia with more detailed descriptions of Great Britain—the specific regions of Anglia, Scotia, and Gallia (England, Scotland and Wales)—illustrates how mapmakers were making individual interventions to suit singular agendas.
2.2.3. The unique elements function
§25 The aforementioned comparison between the Hereford and Sawley maps indicates a relatively large percentage of overlap, especially regarding the Sawley map (68%). Thus, what may interest scholars more in this case would be veccompare’s “unique elements” function, which is able to produce the number and names of two separate sets of toponyms, one that contains the toponyms unique to the Hereford Map, and the other that contains the toponyms unique to the Sawley Map. Veccompare identified 812 place names on the Hereford map that do not overlap with the Sawley map, not unusual given the Hereford map’s large number of toponyms in the first place (966), whereas the Sawley map had only 72 unique toponyms out of 226 that did not overlap with the Hereford map. The Sawley map predates the Hereford map by about 100 years. Given their otherwise close relationship, as depicted by Barber, one might have expected the Hereford mapmakers to have included most, if not all, the toponyms found on the Sawley map. However, despite the Hereford map makers inclusion of 966 toponyms, not all of them overlap with the Sawley Map, raising questions as to the selection of place names for each map, their sources, and why. While the set of 72 toponyms unique to the Sawley map awaits future research, the Sawley-Hereford comparison highlights how veccompare provides quick detailed information about the overlap and non-overlap of unique place names on these maps, how it can do so for any number of maps one selects from the dataset, and how it can help generate entirely new datasets that precipitate new research questions and directions.
2.3. Creating reports and visual representations of data
§26 Veccompare does in minutes what would have taken a lifetime to do with traditional methodological approaches performed by hand. The veccompare package formats its output into multiple variations, each of which serves a different purpose and allows for different points of access to process and analyze the data. The data report takes the output of the compare.vectors command, adds headings that explain the output and returns a markdown-formatted text document that is easy to read. While the sheer amount of data can sometimes be overwhelming – a full PDF document for all 10 maps results in over 1500 hundred pages – veccompare facilitates a close-reading process that map scholars have always practiced, but which can now be completed in a much shorter time frame.
§27 A typical veccompare output report provides a table of contents and section headings to help researchers access basic data without having to read through the entire report. It also provides visual representations for easy access to relational data that may not be immediately apparent in the report. First, veccompare builds on the VennDiagram package for R, which can draw Venn diagrams for up to five-way comparisons (Figure 4a and b). Second, veccompare produces a graph in table format that provides a general overview of all specific two-way comparisons (Figure 5). Third, veccompare transforms the data from the table format into a network graph that shows the intensity of the comparisons. Figure 6a shows overlap connections whenever a map overlaps at least 20% with another map (i.e., when a given map comprising for example 100 toponyms shares at least 20 of its toponyms with a second given map). Overlap connections are drawn directionally – an arrow is manifested between a 100 – toponym map that shares 20 of its toponyms with another map, but not between the second map and the first map, if the second map comprised 1,000 toponyms, of which it shared only 20 with the first map. One can also make the graph a bit less dense, by increasing the overlap threshold between maps to 50%, as seen in Figure 6b (Figure 6a and b).
a and b Venn diagrams from veccompare showing 3-way and 4-way comparisons.
Graph in table format from veccompare showing 2-way comparisons.
a and b Network tables showing percentage of overlap above 20% between all ten maps in the dataset; and above 50%.
§28 Visualizing data in this way may precipitate new research questions, that were previously unimagined. In some cases, these questions can then be translated back into the code for further clarification. For example, in the case study that follows, once the code produced the number and name of toponyms that overlapped between the Psalter Pictorial and List maps, it became interesting to refine the corpus of results to go one step further and ask for a set of toponyms that overlap between the two maps, and no other maps in the dataset. This kind of iterative interaction moves scholars closer to understanding the unique interventions of medieval mapmakers and identifying specific map groupings or families. The graphs also provide means by which to measure relative comparisons between maps. No map in the current dataset overlaps 100% with another, nor do any of the maps not overlap at all. Instead, what the graphs (especially Figure 5) show is the range of overlap defined by percentages between 20–90%, suggesting that while these percentages are relative, they vary significantly and can be used to demonstrate degrees of toponymic relationship between the maps. To note, veccompare shows that the 68% overlap of toponyms between Hereford and Sawley maps is one of the highest seen in the graph, and very different from the respective 20% and 26% overlap seen between the Cotton and Psalter Pictorial map.
§29 A digital tool such as veccompare comes out of the ongoing collaboration of a medieval historian and a data analyst. Veccompare, on its own, will not provide simple answers to complex mappaemundi questions; it is intended to be useful for and complementary to other approaches to map study, including traditional manual analysis.1 In this way, veccompare emphasizes the need of multiple sets of expertise and the fine tuning of back and forth conversations.
§30 While veccompare was built for map comparisons, it can assess overlap between any list of things. In line with this flexibility, the dataset and code used for this project are structured to support ongoing interrogation, flexible enough to adapt to shifting research questions with the map dataset as well as other datasets that may be used. Both veccompare and the dataset of ten mappaemundi (including the diplomatic transcriptions of the toponyms they contain alongside their normalized variants) have been released publicly, and it is the hope that others interested in this type of analytic approach will help and contribute to these freely accessible resources going forward.
3. Using veccompare to explore the relationship between two psalter maps
§31 The catalyst for creating and developing veccompare originated from an initial interest in understanding the relationship between two Psalter maps that share the same folio of a thirteenth-century Psalter (BL Add MS 28681). The Psalter Pictorial mappamundi appears on the recto folio 9, and the Psalter List mappamundi on the verso of the same folio (see Figure 1a and b). Both maps are dated sometime shortly after 1262 and associated with a Westminster Abbey origin.
§32 While the Psalter pictorial map has received much scholarly attention (Terkla 2013, 162; Mittman 2006; Barber 2006, 10; Edson 1997, 12–13; Woodward 1987, 306) the Psalter list map has received substantially less; and few scholars have discussed the nature of the relationship between the two maps (Schöller 2015; Bevan and Phillott 1969). When William Bevan and Henry Phillott (1969, xliv) commented on these maps, they were under the impression that the List map was used as the model, or exemplar, to construct the Pictorial map–although they did note that “the [Psalter List map] does not altogether accord with the [Psalter Pictorial map].” Even though their suggestion of a model-derivative type of relationship makes sense, especially given that the maps share the same folio, Bettina Schöller (2015, 193) has argued that “the discrepancies between the map contents suggest that the Psalter map did not likely serve as a template for the List map.”
§33 Indeed, veccompare’s Venn diagram of the comparison between the two maps does not demonstrate the high percentage of overlap that one would expect if the List map had been used as the toponymic model for the Pictorial map, but instead shows that the two maps share only 44 toponyms – a 33% overlap for the Psalter List map and only a 26% overlap for the Psalter Pictorial map (see Figure 7).
Venn diagram from veccompare showing overlap between the Psalter Pictorial and Psalter List maps.
§34 Thus, the paradox: the maps show a weak connection vis à vis toponym overlap, yet they are inextricably linked through their physicality, since they appear in the same manuscript back to back on the same folio. Schöller (2015, 192) argues that the two maps present equivalent, but separate ways of depicting space, stating that “[a]s a direct result, the maps [one after the other] convey a variety of geographic knowledge.” In addition to their conceptual link, veccompare shows that they also share a toponymic link, both a very direct link through common scribal error and/or corruption, as well as a possible indirect link through the use of a common, and likely already-corrupted source.
§35 Although the two Psalter maps share only 44 toponyms, it is clear that they are connected textually through common scribal error, or corruption. When veccompare produced its first set of results for the two maps, the overlap function produced a list of place names unique to each map including Thazaron for the Psalter List map and Jazaron for the Psalter Pictorial map. Seeing the toponyms like this, side by side, highlighted their similar spelling, and once a shared location was verified, namely in India, the toponym was normalized into a single place name, Jazaron. Neither Jazaron nor Thazaron appear on any other map in the dataset, nor on any other of the almost 40 maps that Konrad Miller has annotated in his comprehensive 1896 publication Die ältesten Weltkarten. Miller (1896, 40) suggests that Jazaron may reflect a corrupt version of a place name that would have been known at the time, though a modern-day equivalent remains unclear. Whatever its referent location, then or now, the toponym of Jazaron links the two Psalter maps through a shared textual variant. A second normalized toponym, Parthan in Albania, presents another textual link unique to the Psalter Pictorial and List maps. When the city of Parthan appears on other medieval mappaemundi, it is situated within the provinces of Armenia or Parthia, not Albania.
§36 The shared location of Parthan in Albania can be seen only on the Psalter maps and is perhaps once again the result of a corrupt version of Parthan in Armenia (see Figure 8a and b). Scribal error or corruption, as in the case with the Psalter maps, was common enough in medieval manuscripts, and as more iterations of a text were copied, more corruptions appeared. The uniqueness of these two Psalter map variants suggests that if the Psalter mapmakers were not consulting each other’s maps for their toponym sets, perhaps they were drawing their place names from a common source that already contained certain corruptions.
a and b Parthan, as seen in Albania in the Psalter Pictorial map. In Albania, civitas Spartun [In Albania, the city of Spartun] as seen in the Psalter List map. BL Add. MS 28681, fol. 9r and 9v, with permission from the British Library, © British Library Board.
§37 This type of supposition can be tested in veccompare using the current dataset of ten maps. When the graph in table format is consulted to determine toponym overlap between all maps in the dataset, both the Psalter Pictorial and List maps show a high correspondence of overlap with Hugh of Saint-Victor’s (c. 1096–1141) Descriptio mappe mundi (c. 1128–29), which survives not as a pictorial map, but as a narrative text that has been edited by Patrick Gautier Dalché (1988), professor at the École pratique des hautes-études in Paris. The overlap of place names between the Psalter Pictorial map and Descriptio mappe mundi is 69% (Figure 9a), and the overlap between the Psalter List map and the Descriptio is 76% (Figure 9b), rendering percentages higher than the 68% already noted between the Hereford and Sawley maps.2
a and b Venn diagrams from veccompare showing overlap between the Psalter Pictorial map and Hugh of Saint-Victor’s Descriptio mappe mundi; and between the Psalter List map and the same Descriptio mappe mundi.
§38 To gain some perspective on how to interpret these percentages, a comparable case can be considered. Patrick Gautier Dalché (1988, 81–85) in his edition of the Descriptio mappe mundi, argues that the Munich Isidore map is the closest surviving relative to the Descriptio, going so far as to suggest that the Descriptio may have been used as a model for the Munich map (Figure 10). The 86% toponym overlap between the Munich Isidore map and the Descriptio, as demonstrated with veccompare, supports Gautier Dalché’s claims. Adding into the mix Peter Barber’s (2006) work on the Hereford and Sawley maps mentioned above, which suggests a strong relationship at 68% overlap of place names, a provisional scale of relational percentages emerges that would place a relatively strong toponymic relationship hovering around 68%, rising to a type of model-derivative relationship around 86%.
Venn diagram from veccompare showing overlap between the Munich Isidore map and Hugh of Saint-Victor’s Descriptio mappe mundi.
§39 Given the direct textual links between the two Psalter maps due to scribal corruption and the high percentage of toponym overlap between the two maps and Hugh of Saint-Victor’s Descriptio mappe mundi, it may be that the Psalter mapmakers used a copy of Hugh’s Descriptio as a principal source from which each mapmaker drew a corpus of toponyms. If this were the case, then one might expect to find the referent variants of Thazaron and Parthan in Albania in the Descriptio. Making direct links between medieval corruptions and their manuscripts is challenging; however, plausible scenarios arise for certain unique place names appearing in the Psalter maps. For the case of Thazaron, Konrad Miller (1896, 40) suggests that Thazaron/Jazaron might be related to Lazorum gens, a toponym that appears in the Ebstorf map. In turn, this may be related to the gens optimam Cathmorum (a people who reside in India) that appears in Hugh of Saint-Victor’s Descriptio. Patrick Gautier Dalché notes that the Cathmorum reference is found only in the Descriptio and the Munich Isidore Map. The corruption journey from Cathmorum to Thazaron/Jazaron is reasonably short. The capital C could have at some point been mistaken for an I or T; and the medial m of Cathmorum, if written sideways as sometimes happened, could have easily been interpreted as a z, mimicking perhaps what may have happened with the Lazorum gens in the Ebstorf.
§40 The extent of corruption that took place over multiple iterations of medieval manuscripts cannot be underestimated. The Psalter List Map provides an excellent example; one of the entries in Asia reads In Media: Meda et Elam. In Affrica: Thesia et Archademon. [In Media, the cities of Meda and Elam. In Africa, the cities of Thesia and Archademon.] At first glance, is the mapmaker really placing Africa in Asia (Figure 11)? When considered rather as a potential corruption, one might read In Media: Meda et Elam. In Assiria: Thesia et Archimedon. While Assyria is a toponym that appears in several sources, Hugh of Saint-Victor’s Descriptio (Gautier Dalché 1988, 142) is the only other source in the dataset that provides the toponym Archimedon, and it is placed in close proximity to Assyria. This also sets the corruption of Parthan in Albania for Parthan in Armenia even more within the scope of possibility, given the extent of corruption already present. The unique variants of two corrupted place names in both the Psalter Pictorial and Psalter List maps, as well as the high percentage of toponym overlap that both maps share with Hugh of Saint-Victor’s Descriptio mappe mundi allude to a situation where although the maps were made by different mapmakers, the scribes may have each used an already-corrupt copy of the Descriptio to fill in the selected toponyms for their respective maps.
In Media: Meda et Elam. In Affrica (read Assiria): Thesia et Archademon (read Archimedon.) [In Media, cities of Meda and Elam. In Assyria, the cities of Thesia and Archimedon]. BL Add. MS 28681, fol. 9v. With permission from the British Library, © British Library Board.
§41 For historians of the book, this kind of evidence sheds light on larger issues of manuscript production and transmission: if the maps can be linked to a common source, they may be able to be linked to a common institution or workshop that had access to that source. For historians of medieval cartography, the evidence suggests that the Psalter List Map indeed belongs to Terkla’s grouping of English mappaemundi associated with Hugh of Saint-Victor’s theography. Through the automated comparison of toponym content, veccompare’s ability to calculate overlap between maps and create lists of unique places names from a multitude of possible combinations adds a new tool for researchers in the ongoing study of the complicated relationships and networks formed between surviving medieval mappaemundi.
4. Conclusions
§42 Working on this project has created a space where two separate academic domains have come fully to bear on the topic – this has not been a digital humanities project, nor a digital humanities project. Looking beyond medieval maps specifically at non-standardized text more generally, this work requires a back-and-forth conversation between domain experts and analysts. It is an iterative and ongoing process, that allows for deeper communication between disciplines, with an outcome that could not have been manifested without communication and collaboration.
§43 Moving from two separate fields with specialized vocabularies into a third space, which accommodates both, allows for new conversations, new streamlined vocabularies, and new scholarship. That “normalized” third space, if you will, has fostered the creation of a “normalized” dataset specific to this project. Moreover, allowing space for collaborative conversation provides a model environment for talking about structuring these data for ready reuse. Put differently, while the normalized dataset of medieval place names and the digital tool of veccompare are important tools to supplement traditional medieval cartographical research methods, other domains and fields can benefit from veccompare’s basic commands and model an open and documented collaborative data-building style moving forward. The process of supplementing and automating the straightforwardly-reproducible parts of the workflow of a researcher in medieval cartography provides not only fodder for novel, cross-disciplinary analysis approaches, but also normalizes those conversations.
§44 Moving forward with this project, these conversations have focused attention both on new research questions drawn from the data, as well as larger questions of free-text normalization beyond fuzzy medieval data. One of the more surprising results from the emerging dataset was the fact that only three toponyms appear on all ten maps in the dataset: Sicily, Ireland and Rome. This raises some interesting data questions, in addition to conceptual medievalist ones. Is this an artifact of the data normalization decisions? Would this pattern emerge if map elements were normalized differently, for example, by stripping all qualifiers from them? How could the normalization process be better, and resolve editorial decisions in a more transparent manner? For example, in the treatment of Scythia and Scythia Inferior as two separate toponyms, would further refinement shape the answer to the question of what is shared across all the maps?
§45 Working iteratively on questions about free-text normalization has allowed us to make progress without being overwhelmed and never getting started. Further normalization approaches have been discussed and could include tagging aspects of the data with a lightweight markup language that could then be converted into more standard formats such as the TEI (for example, allowing all maps that use “Scythia,” whether “Inferior” or “Superior,” to be compared with one another), adding markup for cross-referencing corruptions to one another, and storing the dataset by default in “tidy” formats (the R scripts that are included with the dataset allow transformation from the current format in the meantime). To that end, the dataset now includes R scripts for transforming the data into several alternative formats, for more ready use by others. Because maps are modelled here as vectors, or collections of place names, veccompare is useful for any type of data that can be modeled as lists or collections. Set comparisons themselves are not complicated, but the logic of figuring out all possible combinations among sets at a given number of levels, of figuring out the percentage overlap for each section of Venn diagrams, is. Thus, in automating this for even large collections of sets, it is our hope to make a contribution beyond the scope of veccompare’s analysis of cartographical medieval data.
Additional File
The additional file for this article can be found as follows:
A step-by-step set of instructions for using veccompare and a more detailed explanation of RStudio. DOI: https://doi.org/10.16995/dm.84.s1
Notes
- While researchers are working on HTR (handwritten text recognition)-type technology for deconstructing and reconstructing Latin scripts found in original sources (e.g. https://transkribus.edu/Transkribus/), it has not yet replaced the need for the manual labor of transcribing medieval place names. It is possible, however, that in the future, an algorithm might be developed to match diplomatic transcriptions with the likeliest normalized place name selected from the set developed in this project, and flag “new” ones when there is no obvious match. [^]
- Bettina Schöller (2015) has discussed the relationship between the Psalter Maps and Hugh of Saint-Victor’s Descriptio mappe mundi. She suggests that the Psalter Pictorial map is almost certainly drawn from Hugh’s narrative description of a world map. Not only is there high toponym overlap, but there is also a strong correspondence between the organization of geographical features. She finds that this is not the case with the Psalter List map, noting “the assignment of the cities to the provinces is often different,” (193) and ths does not support a strong relationship with the Descriptio despite the high percentage of overlap with place names. Instead, she states that: “It seems probable that the Psalter Map verso is a copy of an older list map.” (193). [^]
Competing Interest
The authors have no competing interests to declare.
Author Contributions
The corresponding author is hw. Authorship is alphabetical after the drafting author and principal technical lead. Author contributions, described using the CASRAI CredIT typology, are as follows:
Heather Wacha: hw
Jacob Levernier: jl
Authors are listed in descending order by significance of contribution. The corresponding author is hw
Conceptualization: hw, jl
Methodology: hw, jl
Software: jl
Formal Analysis: hw
Investigation: hw, jl
Data Curation: hw, jl
Writing – Original Draft Preparation: hw
Writing – Review & Editing: hw, jl
Editorial Contributions
Recommending editors: Mike Kestemont, University of Antwerp, Belgium
Recommending referee: Iason Jongepier, University of Antwerp, Belgium; Folgert Karsdorp, Meertens Instituut, Netherlands
Section/Copy Editor: Shahina Parva
Layout Editor: Mahsa Miri
References
Barber, Peter. 2006. “Medieval Maps of the World.” In The Hereford World Map: Medieval World Maps and Their Context, edited by P. D. A. Harvey, 285–370. London: The British Library.
Barney, Stephen A., Wendy J. Lewis, Jennifer A. Beach, and Oliver Berghof. 2006. The Etymologies of Isidore of Seville. Cambridge: Cambridge University Press. DOI: http://doi.org/10.1017/CBO9780511482113
Baron, Roger. 1956. “Hugh of Saint-Victor, Lexicographe: Trois textes inédits.” Cultura Neolatina 16: 110–45.
Bevan, William Latham, and Henry Wright Phillott. 1969. Medieval Geography: An Essay in Illustration of the Hereford Mappa Mundi. Amsterdam: Meridian.
Brott, LauraLee. 2018. “The Geography of Devotion in the British Library Psalter Maps.” Cartographica 53(3): 211–24. DOI: http://doi.org/10.3138/cart.53.3.2017-0029
Bussell, Donna Alfano, and Joseph M. McNamara. 2013. “Barking Abbey: A GIS Map of a Medieval Nunnery.” Peregrinations: Journal of Medieval Art and Architecture 4(2): 173–89.
Edson, Evelyn. 1997. Mapping Time and Space. London: British Library.
Fear, A. T. trans. 2010. Orosius: Seven Books of History Against the Pagans. Liverpool: Liverpool University Press. DOI: http://doi.org/10.3828/978-1-84631-473-5
Fordham University. 2019. “Oxford Outremer Map Project.” Accessed November 10. https://medievaldigital.ace.fordham.edu/mapping-projects/oxford-outremer-map-project/.
Foys, Martin. 2006. “An Unfinished Mappamundi from Late Eleventh-Century Worcester: CCCC 265 and the Evidence for a Family of Late Anglo-Saxon Maps.” Anglo-Saxon England 35: 271–84. DOI: http://doi.org/10.1017/S0263675106000135
Gautier Dalché, Patrick. 1988. La «Descriptio mappe mundi» de Hugues de Saint-Victor. Paris: Études Augustiniennes.
Gautier Dalché, Patrick. 2008. “L’héritage antique de la cartographie médiévale.” In Cartography in Antiquity and the Middle Ages: Fresh Perspectives, New Methods, edited by Richard J. A. Talbert and Richard Watson Unger, 29–66. Leiden: Brill.
Harvey, P. D. A. 2006. The Hereford World Map: Medieval World Maps and Their Context. London: British Library.
Harvey, P. D. A. 2012. Medieval Maps of the Holy Land. London: The British Library.
Herzog August Bibliothek Wolfenbüttel. 2019. “Liber Floridus: Wolfenbüttel, Herzog August Bibliothek Handschriftendatenbank, Ms. Gudeanus lat. 1., fol. 69v.” Accessed November 13. http://diglib.hab.de/?db=mss&list=ms&id=1-gud-lat.
Kupfer, Marcia. 2016. Art and Optics in the Hereford Map: An English Mappa Mundi, c. 1300. New Haven: Yale University Press.
Miller, Konrad. 1896. Mappaemundi: Die ältesten Weltkarten. Stuttgart: Roth.
Mittman, Asa. 2006. Maps and Monsters in Medieval England. New York: Routledge.
Munich Isidore Map: Bayerische Statsbibliotek, Clm 10058, fol. 154v. 1988. In La «Descriptio mappamundi» de Hugues de Saint-Victor, edited by Patrick Gautier Dalché, 103–5. Paris: Études Augustiniennes.
Rackham, Harris, William H. S. Jones, and D. E. Eichholz. 2014. Pliny: Natural History. Cambridge: Harvard University Press.
Reudenbach, Bruno. 1988. “Die Londoner Psalterkarte und ihre Rückseite: Ökumenekarten als Psalterillustration.” Frühmittelalterliche Studien 32: 164–181. DOI: http://doi.org/10.1515/9783110242300.164
Rochester University. 2019. “The Lazarus Project: The Vercelli Map.” Accessed November 10. http://www.lazarusprojectimaging.com/previous-projects/vercelli-mappamundi/.
Schöller, Bettina. 2015. Wissen speichern, Wissen ordnen, Wissen übertragen Schriftliche und bildliche Aufzeichnungen der Welt im Umfeld der Londoner Psalterkarte. Zürich: Chronos Verlag.
Swansea University, Queen’s University Belfast, and the Centre for Computing in the Humanities at King’s College London. 2019. “Mapping Medieval Chester: Place and Identity in an English Borderland City c.1200–1500.” Accessed November 10. http://www.medievalchester.ac.uk/.
Talbert, Richard J. A., and Richard Watson Unger. 2008. Cartography in Antiquity and the Middle Ages: Fresh Perspectives, New Methods. Leiden: Brill.
Team R. Core. 2017 “R: A Language and Environment for Statistical Computing. R Foundation for Statistical Computing, Vienna, Austria.” Accessed July 23, 2019. https://www.r-project.org.
Terkla, Dan. 2013. “Hugh of St Victor (1086–1141) and Anglo-French Cartography.” Imago Mundi 65: 161–79. DOI: http://doi.org/10.1080/03085694.2013.784091
Universiteits Bibliotheek Gent. 2019. “Liber Floridus: Ghent, Ghent University, MS 92, fol. 241r.” Accessed November 13. https://www.liberfloridus.be/wie_eng.html.
Van Duzer, Chet. 2019. Henricus Martellus’s World Map at Yale (c. 1491): Multispectral Imaging, Sources, and Influence. New York: Springer. DOI: http://doi.org/10.1007/978-3-319-76840-3
Virtual Mappa Project. 2018. “Cotton Map: British Library, Cotton Tiberius B v, fol. 56r.” Accessed July 23, 2019. https://sims2.digitalmappa.org/36.
Virtual Mappa Project. 2018. “Hereford Map: Hereford Cathedral.” Accessed July 23, 2019. https://sims2.digitalmappa.org/36.
Virtual Mappa Project. 2018. “Psalter List Map: British Library, Add. MS 28681, fol. 9v.” Accessed July 23, 2019. https://sims2.digitalmappa.org/36.
Virtual Mappa Project. 2018. “Psalter Pictorial Map: British Library, Add. MS 28681, fol. 9r.” Accessed July 23, 2019. https://sims2.digitalmappa.org/36.
Virtual Mappa Project. 2018. “Sawley Map: CCCC 66, Parker Library, p. 2.” Accessed July 23, 2019. https://sims2.digitalmappa.org/36.
Werner, Hermann. 1969. Die “Collectanea rerum memorabilium” des C. Julius Solinus; ihre Entstehung und die Echtheit ihrer Zweitfassung. Wiesbaden: F. Steiner.
Woodward, David. 1987. “Medieval Mappaemundi.” In The History of Cartography, vol. 1: Cartography in Prehistoric, Ancient, and Medieval Europe and the Mediterranean, edited by J. B. Harley and David Woodward, 286–370. Chicago: University of Chicago Press.